
Dashboards
1.1 Definition
A Dashboard in ServiceNow is a visual interface that displays real-time information using reports, charts, lists, and performance indicators. It helps users monitor data, track performance, and make quick decisions without navigating multiple records.
1.2 Scenario
1.2.1 Show state-wise incident Count.
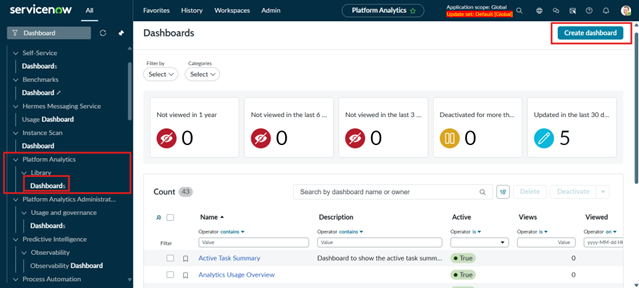
Heading to All -> Platform Analytics -> Library -> Dashboards
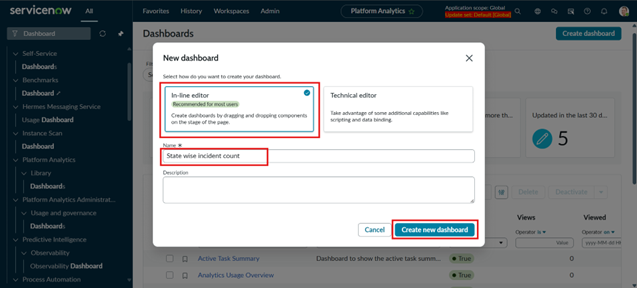
Select -> In-line Editor, Give Name -> State Wise Incident Count, Create Dashboard
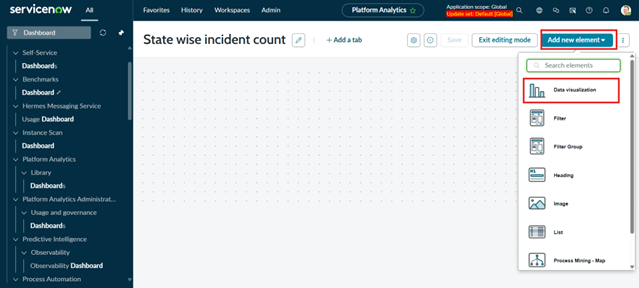
Add new Element -> Data Visualization
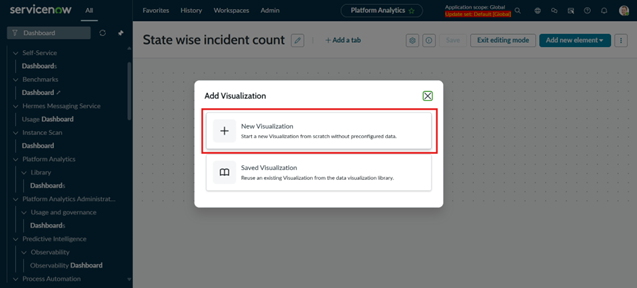
Select -> New Visualization
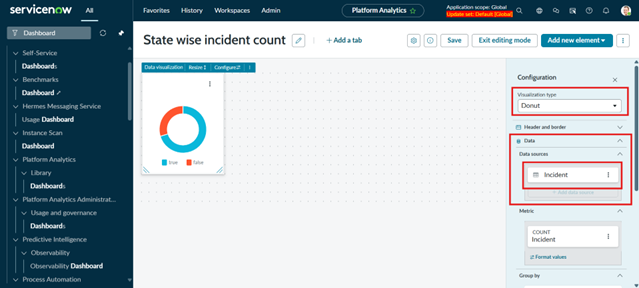
Select Visualization type-> Donut, Data Sources -> Incident (Table)
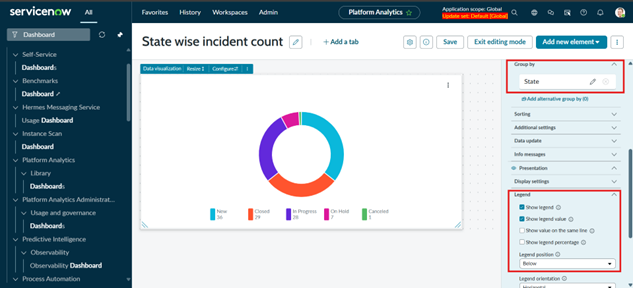
Select Group By -> State, Legend -> Show legend and show legend value
1.3 Real-Time Use Case Examples
1.3.1 Incident Management Dashboard
- Open incidents by priority
- SLA breaches in real time
- Incidents assigned to the current user
Helps support teams focus on critical issues first.
1.4 Summary
Dashboards in ServiceNow provide a powerful way to visualize and monitor data in real time. By combining reports, widgets, and filters, dashboards help users at all levels quickly understand system performance and take informed actions. When designed effectively, dashboards improve efficiency, transparency, and overall service quality.